World Meteorological Organization Global Weather & Climate Extremes Archive
Global Weather
Global Weather & Climate Extremes
| World Weather Element | World Element Characteristic | Value | Date (D/M/Y) | Site Observations | Geopolitical Location | Longitude/ Latitude | Elevation |
|---|---|---|---|---|---|---|---|
| Temperature | Highest Temperature | 56.7°C (134°F) | 10/7 (July) /1913 | 1911- present | Furnace Creek (Greenland Ranch), CA, USA | 36°27'N, 116°51'W | -54m (-179ft) ) |
| Lowest Temperature | -89.2°C (-128.6°F) | 21/7 (July) /1983 | 1912- present | Vostok, Antarctica | 77°32'S, 106°40'E | 3420m (11,220 ft) | |
| Pressure | Highest Sea Lvl Air Pressure Below 750m | 1083.8 hPa | 31/12 (December) /1968 | 1961- present | Agata, Russia | 66°53'N, 93°28'E | 261m (856.3ft) |
| Highest Sea Lvl Air Pressure Above 750m | 1089.1 hPa | 30/12 (December) /2004 | 1963- present | Tosontsengel Mongolia | 48°44'N, 98°16'E | 1724.6m (5658.1 ft) | |
| Lowest Sea Lvl Air Pressure (excluding tornadoes) | 870 hPa | 12/10 (October) /1979 | 1951- present | Eye of Typhoon Tip | 16°44'N, 137°46'E | 0m | |
| Rainfall | Greatest 1-Min Rainfall | 31.2mm (1.23") | 4/7 (July) /1956 | 1948- present | Unionville, MD, USA | 38°48'N, 76°08'W | 152m (499ft) |
| Greatest 60-Min Rainfall | 305mm (12.0") | 22/6 (June) /1947 | Holt, MO, USA | 39°27'N, 94°20'W | 263m (863ft) | ||
| Greatest 12-Hr Rainfall | 1.144 m (45.0'') | 7-8/1 (January) /1966 | 1966-1990 | Foc-Foc, La Réunion | 21°14'S, 55°41'E | 2290m (7513ft) | |
| Greatest 24-Hr Rainfall | 1.825m (71.8") | 7-8/1 (January) /1966 | 1966-1990 | Foc-Foc, La Réunion | 21°14'S, 55°41'E | 2290m (7513ft) | |
| Greatest 48-Hr Rainfall | 2.493m (98.15") | 15-16/6 (June) /1995 | 1850-present | Cherrapunji, India | 25°02'N, 91°08'E | 1313m (4308ft) | |
| Greatest 72-Hr Rainfall | 3.930m (154.72") | 24-26/2 (February) /2007 | 1968-present | Cratère Commerson, La Réunion | 21°12'S, 55°39'E | 2310m (7579ft) | |
| Greatest 96-Hr Rainfall | 4.936m (194.33") | 24-27/2 (February) /2007 | 1968-present | Cratère Commerson, La Réunion | 21°12'S, 55°39'E | 2310m (7579ft) | |
| Greatest 12-Mo Rainfall | 26.47m (1042") | 8 (August)/1860-7 (July)/1861 | 1851- present | Cherrapunji, India | 25°02'N, 91°08'E | 1313m (4308ft) | |
| Hail | Heaviest Hailstone | 1.02kg (2.25lb) | 14/4 (April) /1986 | Gopalganj district, Bangladesh | 23°00'N, 89°56'E | 4m (13.1ft) | |
| Aridity | Longest Dry Period | 172 months | 10 (October)/1903-1 (January)/1918 | Arica, Chile | 18°29'S, 70°18'W | 65m (213ft) | |
| Wind | Maximum Gust | 113.2m/s (253mph; 220kt) | 1055 UTC 10/4 (April) /1996 | 1932- present | Barrow Island Australia | 20°49'S, 115°23'E | 64m (210ft) |
| Maximum Gust for Tropical Cyclone | 113.2m/s (253mph; 220kt) | 1055 UTC 10/4 (April) /1996 | 1949-present | Barrow Island Australia | 20°49'S, 115°23'E | 64m (210ft) | |
| Lightning | Longest Distance Lightning Flash | 768 ± 8 km (477.2 ± 5 mi) | 4:32:39.026 UTC -> 14:32:47.568 UTC on 29/4 (April)/2020 | 1/1/2018-present | Crossing between the states of Mississippi and Texas in the United States | 30.83°N;, 88.84°W; to 28.69°S; 92.42°W; | |
| Longest Duration Lightning Flash | 17.102 ± 0.002 seconds | 06:48:58.822 UTC - 06:49:15.924 UTC 18/6 (June)/2020 | 1/1/2018-present | Crossing portions of Argentina and Uruguay | 36.25°S;, 57.22°W; to 31.68°S; 58.06°W; | ||
| Weather-Related Mortality | Highest Mortality: Lightning | 469 individuals | 2/11 (Nov)/1994 | 1873-present | Dronka, Egypt | 27.2°N;, 31.0°W; | |
| Highest Mortality: Lightning (single stroke) | 21 individuals | 23/12 (Dec)/1975 | 1873-present | Manica Tribal Trust Lands, Zimbabwe | 18.5°S;, 32.58°E; | ||
| Highest Mortality: Tropical Cyclone | estimated 300,000 individuals | 12-13/11 (Nov)/1970 | 1873-present | coastal Bangladesh | 22.3°N;, 91.8°W; | ||
| Highest Mortality: Tornado | estimated 1,300 individuals | 26 /4 (April) /1989 | 1873-present | Manikganj district, Bangladesh | 22.80°N;, 90.1°E; | ||
| Highest Mortality: Hailstorm | 246 individuals | 20/4 (April)/1888 | 1873-present | Moradabad, India | 28.80°N;, 78.8°E; |
Hemispheric Weather
Hemispheric Weather & Climate Extremes
| Hemisphere | Continental Element Characteristic | Value | Date (D/M/Y) | Length of Record | Geopolitical Location | Longitude/ Latitude | Elevation |
|---|---|---|---|---|---|---|---|
| Northern Hemisphere | Highest Temperature | 56.7°C (134°F) | 10/7 (July)/1913 | 1911- present | Furnace Creek (Greenland Ranch), CA, USA | 36°27'N, 116°51'@ | -54m (-179ft) ) |
| Southern Hemisphere | Highest Temperature | 50.7°C (123°F) | 2/1 (January)/1960 | 59 years | Oodnadatta, Australia | 27°32'S, 135°26'E | 112m (367 ft) |
| Eastern Hemisphere | Highest Temperature | 55.0°C (131°F) | 7/7 (July)/1931 | unknown | Kebili, Tunisia | 33°42'N, 8°58'E | 38.1m (125ft) |
| Western Hemisphere | Highest Temperature | 56.7°C (134°F) | 10/7 (July) /1913 | 1911- present | Furnace Creek Ranch, CA, USA | 36°27'N, 116°51'W | -54m (-179 ft) |
| Northern Hemisphere | Lowest Temperature | -69.6°C (-93.3°F) | 22/12 (December)/1991 | 1989-1994 | Klinck AWS Greenland | 72°18'N, 40°28'E | 3216m (10,551 ft) |
| Southern Hemisphere | Lowest Temperature | -89.2°C (-128.6°F) | 21/7 (July)/1983 | 1912-present | Vostok, Antarctica | 77°32'S, 106°40'E | 3420m (11220 ft) |
| Eastern Hemisphere | Lowest Temperature | -89.2°C (-128.6°F) | 21/7 (July)/1983 | 1912-present | Vostok, Antarctica | 77°32'S, 106°40'E | 3420m (11220 ft) |
| Western Hemisphere | Lowest Temperature | -69.6°C (-93.3°F) | 22/12 (December)/1991 | 1989-1994 | Klinck AWS Greenland | 72°18'N, 40°28'E | 3216m (10,551 ft) |
| Northern Hemisphere | 24-hour Rainfall | 1633.98mm (64.3") | 21-22/10 (November)/2005 | Isla Mujeres, Mexico | 21°15'N, 86°44'W | 3m (10 ft) | |
| Southern Hemisphere | 24-hour Rainfall | 1825mm (72.0") | 7-8/1 (January)/1966 | 1966-1990 | Foc-Foc, La Reunion | 21°14'S, 55°40'E | 2990m (9810ft) |
| Eastern Hemisphere | 24-hour Rainfall | 1825mm (72.0") | 7-8/1 (January)/1966 | 1966-1990 | Foc-Foc, La Reunion | 21°14'S, 55°40'E | 2990m (9810ft) |
| Western Hemisphere | 24-hour Rainfall | 1633.98mm (64.3") | 21-22/10 (October)/2005 | Isla Mujeres, Mexico | 21°15'N, 86°44'W | 3m (10 ft) | |
| Eastern Hemisphere | Heaviest Hailstone | 1.02kg (2.25lb) | 14/4 (April)/1986 | Gopalganj district, Bangladesh | 23°00'N, 89°56'E | 4m (13.1ft) | |
| Western Hemisphere | Heaviest Hailstone | 0.88 kg (1.94lb) | 23/7 (July)/2010 | Vivian, South Dakota | 43°55'N, 100°17'W | 581 meters (1907 ft) | |
| Northern Hemisphere | Maximum Wind Gust | 103.3 m/s (231 mph) | 12/4 (April)/1934 | 1932-present | Mt. Washington NH USA | 44°16'N, 71°18'W | 1856m (6089 ft) |
| Southern Hemisphere | Maximum Wind Gust | 112.3m/s (253mph; 220kt) | 10/4 (April)/1996 | 1932- present | Barrow Island Australia | 20°49'S, 115°23'E | 64m (210ft) |
| Eastern Hemisphere | Maximum Wind Gust | 112.3m/s (253mph; 220kt) | 10/4 (April)/1996 | 1932- present | Barrow Island Australia | 20°49'S, 115°23'E | 64m (210ft) |
| Western Hemisphere | Maximum Wind Gust | 103.3 m/s (231 mph) | 12/4 (April)/1934 | 1932-present | Mt. Washington NH USA | 44°16'N, 71°18'W | 1856m (6089 ft) |
Continental Weather
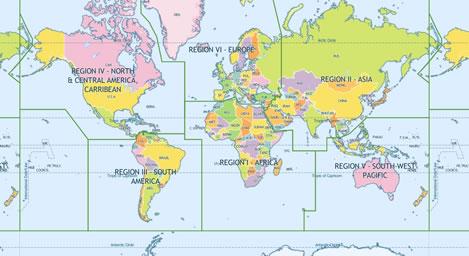
Continental Weather & Climate Extremes: Based on World Meteorological Organization Defined Regions
| WMO Region | Continental Element Characteristic | Value | Date (D/M/Y) | Length of Record | Geopolitical Location | Longitude/ Latitude | Elevation |
|---|---|---|---|---|---|---|---|
| WMO Region I: Africa | Highest Temperature | 55.0°C (131°F) | 7/7 (July)/1931 | unknown | Kebili, Tunisia | 33°42'N, 8°58'E | 38.1m (125ft) |
| WMO Region II: Asia | Highest Temperature | 1. 53.9°C ±0.1°C (129.0°F ±0.2°F) 2. 53.7 °C ± 0.4 °C (128.7°F ±0.7°F |
1. 21/7 (July)/2016, 2. 28/5 (May)/2017 |
1. Mitribah, Kuwait 2. Turbat Pakistan |
1. 29°N 49’28’, 47°E 21’35’ 2. 25°N 59’, 63°E 04’ |
1. 119.56m (398 ft) 2. 151 m (495 ft) |
|
| WMO Region III: South America | Highest Temperature | 48.9°C (120°F) | 11/12 (December)/1905 | Rivadavia, Argentina | 24°10'S, 62°54'W | 205m (672.6 ft) | |
| WMO Region IV: North America | Highest Temperature | 56.7°C (134°F) | 10/7 (July)/1913 | 1911- present | Furnace Creek Ranch, CA, USA | 36°28'N, 116°51'W | -54m (-179 ft) |
| WMO Region V: Southwest Pacific | Highest Temperature | 50.7°C (123°F) | 2/1 (January)/1960 | 59 years | Oodnadatta, Australia | 27°32'S, 135°26'E | 112m (367 ft) |
| WMO Region VI: Europe (including Middle East/Greenland) | Highest Temperature | 54°C (129°F) | 21/6 (June)/1942 | Tirat Tsvi (Tirat Zevi) Israel | 32°25'N, 35°32'E | -220m (-722 ft) | |
| WMO Region VI: Europe (Continental) | Highest Temperature | 48.0°C (118.4°F) | 10/7 (July)/1977 | 1956-present | Athens, Greece (and Elefsina, Greece) | 38°06'N, 23°47'W | 236m (774 ft) |
| WMO Region VII: Antarctic Region (all land/sea south of 60°S) | Highest Temperature | 19.8°C (67.6°F) | 30/1 (January)/1982 | Signy Research Station (UK) | 1947-present (summer only: 1996 on) | 60°43' S, 45°36' W | 7m (23.0 ft) |
| WMO Region VII: Antarctic Region (mainland & adjoining islands) | Highest Temperature | 18.3°C (64.9°F) | 6/2 (Februrary)/2020 | Esperanza Research Station (Argentina) | 1953-present | 63°24' S, 56°59' W | 24m( (78.7 ft) |
| WMO Region VII: Antarctic Region (plateau>2500 m) | Highest Temperature | -7.0°C (19.4°F) | AWS D-80 inland of the Adélie Coast | 14/1/ 1983 to 1/1/2001 | 70°6' S, 134°53'E | 2500m( (8202 ft) | |
| Arctic Circle (region =>66.5°) | Highest Temperature | 38.0°C (100.4°F) | Verkhoyansk, Russian Federation | 1/1/ 1953 to present | 67°31’N, 134.40°53'E | 138m( (452.8 ft) | |
| WMO Region I: Africa | Lowest Temperature | -23.9°C (-11°F) | 11/2 (February)/1935 | 1912-present | Ifrane, Morocco | 33°30'N, 5°06'W | 1635m (5364 ft) |
| WMO Region II: Asia | Lowest Temperature | -67.8°C (-90°F) | 1. 5/2 (February)/1892, 7/2 (February)/1892 2. 6/2 (February)/1933 |
1. Verkhoyansk, Russia, 2. Oimekon, Russia |
1. 67°33'N, 133°23'E 2. 63°28'N, 142°23'E |
1. 107m (350 ft) 2. 800m (2625 ft) |
|
| WMO Region III: South America | Lowest Temperature | -32.8°C (-27°F) | 1/6 (June)/1907 | Sarmiento, Argentina | 54°21'S 68°11'W | 268m (879 ft) | |
| WMO Region IV: North America | Lowest Temperature | -63.0°C (-81.4°F) | 3/2 (February)/1947 | 1943-1966 | Snag, Yukon Territory, Canada | 140°22'W, 62°23'N | 646m (2120 ft) |
| WMO Region V: Southwest Pacific | Lowest Temperature | -25.6°C (-14.0°F) | 17/7 (July)/1903 | 1897-present | Ranfurly in New Zealand | 45°08'S, 170°06'E | 423m (1388 ft) |
| WMO Region V: Southwest Pacific (Australia, only) | Lowest Temperature | -23°C (-9.4°F) | 29/6/1994 | Charlotte Pass, New South Wales | 36°31'S, 148°19'E | 1755m (5758 ft) | |
| WMO Region VI: Europe (including Middle East/Greenland) | Lowest Temperature | -69.6°C (-93.3°F) | 22/12 (December)/1991 | 1989-1994 | Klinck AWS Greenland | 72°18'N, 40°28'E | 3216m (10,551 ft) |
| WMO Region VI: Europe (Continental) | Lowest Temperature | -58.1°C (-72.6°F) | 31/12 (December)/1978 | Ust 'Schugor, Russia | 57°45'E, 64°15'N | 85m (279 ft) | |
| WMO Region VII: Antarctic Region | Lowest Temperature | -89.2°C (-128.6°F) | 21/7/1983 | 1912-present | Vostok, Antarctica | 77°32'S, 106°40'E | 3420m (11220 ft) |
| Arctic Circle (region =>66.5°) | Lowest Temperature | -69.6°C (-93.3°F) | 22/12 (December)/1991 | 1989-1994 | Klinck AWS Greenland | 72°18'N, 40°28'E | 3216m (10,551 ft) |
| WMO Region I: Africa | Greatest Precipitation (average annual) | 10.287m (405.0") | 32 years | Debundscha, Cameroon | 4°06'N, 8°59'E | 9m (30 ft) | |
| WMO Region II: Asia | Greatest Precipitation (average annual) | 11.872m (467.4") | 38 years | Mawsynram, India | 25°18'N, 91°35'E | 1431m (4695 ft) | |
| WMO Region III: South America | Greatest Precipitation (average annual) | 8.99 m (354.0") | 29 years | Quibdo, Colombia | 5°41'N, 76°40'W | 70m (230 ft) | |
| WMO Region IV: North America | Greatest Precipitation (average annual) | 7m (276") | 1923-1935; 1998-2000 | 15 years | Henderson Lake, BC, Canada | 49°88'N, 125°08'W | 3.66m (12 ft) |
| WMO Region V: Southwest Pacific | Greatest Precipitation (average annual) | 11.64m (460.0") | 30 years | Mt. Waialeale, Kauai, Hawaii, USA | 22°04'N, 159°29'W | 1569m (5148ft) | |
| WMO Region V: Southwest Pacific (Australia only) | Greatest Precipitation (average annual) | 8.034m (316.3") | 34 years | Bellenden Ker, Queensland | 17°16'S, 145°51'E | 1555m (5102 ft) | |
| WMO Region VI: Europe | Greatest Precipitation (average annual) | 4.593m (180.8") | 1961-1990 | 30 years | Crkvice, Montenegro | 43°00'N, 18°30'E | 1055m (3461 ft) |
| WMO Region VII: Antarctic Region | Greatest Precipitation (average annual) | >800mm (31.5") water equivalent (460.0") | Jul 1996–Jun 1999 | along the coast of East and West Antarctica, and over the Antarctic Peninsula | |||
| WMO Region I: Africa | Least Precipitation (average annual) | < 2.54mm (< 0.1") | 39 years | Wadi Halfa, Sudan | 21°47'N, 31°22'E | 180m (590 ft) | |
| WMO Region II: Asia | Least Precipitation (average annual) | 45.7mm (1.8") | 50 years | Aden, Yemen | 12°45'N, 45°4'E | 19m (63 ft) | |
| WMO Region III: South America | Least Precipitation (average annual) | 0.76mm (0.03") | 59 years | Arica, Chile | 18°29'S, 70°18'W | 65m (213 ft) | |
| WMO Region IV: North America | Least Precipitation (average annual) | 30.5 mm (1.2") | 14 years | Batagues, Mexico | 32°33'N, 115°04'W | 21m (69 ft) | |
| WMO Region V: Southwest Pacific | Least Precipitation (average annual) | 102.9mm (4.05") | 42 years | Troudaninna, South Australia | 29°03'S, 139°10'E | 14m (46 ft) | |
| WMO Region VI: Europe (continental) | Least Precipitation (average annual) | 162.6mm (6.4") | 25 years | Astrakhan, Russia | 46°22'N, 48°00'E | 20m (66 ft) | |
| WMO Region VII: Antarctic Region | Least Precipitation (average annual) | 2mm (0.08") | 10 years | Amundsen-Scott South Pole Station | 90°S | 2,835m (9,301 ft) |
World Tornado Records
| Tornado Characteristic | Value | Date (D/M/Y) | Length of Record | Geopolitical Location | Longitude/ Latitude | Elevation |
|---|---|---|---|---|---|---|
| Highest Mortality: Tornado | estimated 1,300 individuals | 26 /4 (April) /1989 | 1873-present | Manikganj district, Bangladesh | 22.80°S;, 90.1°E; | |
| Longest-lasting / Greatest Distance Traveled (single tornado) | 352.4km (219 miles) / 3.5 hours duration | 18/3/1925 | Ellington MO USA to Princeton IN USA | |||
| Biggest (Numerical) Tornado Outbreak | 209 Tornadoes | 27/4 (April)/2011 | 1787- present | Southeastern United States | ||
| Widest Tornado (maximum diameter) | 4184 meters (2.6 mi.) in width | 31/ 5 (May) 2011 | El Reno Oklahoma EF5 Tornado | 35°31'N, 97°57'W | 4184 m (2.6 miles) | |
| Calendar Month with Greatest number of Tornadoes | 543 tornadoes | 5 (May)/2003 | 1950- present | United States | ||
| Highest Recorded Tornadic Wind Speed | 135m/s (302 mph) | 3/5 (May)/1999 | ~1996- present | Bridge Creek, OK USA | 35°14'N, 97°44'W | 416m (1365 ft) |
| Longest Tornado Transport | A personal check carried 359 km (223 mi.) | 11/4 (April)/1991 | 1871- present | Stockton, KS USA to Winnetoon, NE USA |
World Tropical Cyclone Records
| Tropical Cyclone Characteristic | Value | Date (D/M/Y) | Length of Record | Tropical Cyclone | Latitude/ Longitude |
|---|---|---|---|---|---|
| Highest Mortality: Tropical Cyclone | estimated 300,000 individuals | 12-13/11 (Nov)/1970 | 1873-present | coastal Bangladesh | 22.3°N;, 91.8°W; |
| Most Intense - by Central Pressure (World and Eastern Hemisphere) | 870mb (25.69") | 12/10 (October)/1979 | 1951- present | Typhoon Tip in the Northwest Pacific Ocean | 16°44'N, 137°46'E |
| Most Intense - by Central Pressure (Western Hemisphere) | 872mb (26.75") | 1200 UTC 23 / 10 (October)/ 2015 | 1951- present | Hurricane Patricia in eastern Pacific Ocean | 17°18'N, 105°47'W |
| Most Intense - by Maximum Sustained Surface Wind (TIE) | 95m/s (185 kt, 215 mph) | 12/9 (September)/1961 | 1945- present | Typhoon Nancy in the Northwest Pacific Ocean | 15°30'N, 137°30'E |
| Most Intense - by Maximum Sustained Surface Wind (TIE) | 95m/s (185 kt, 215 mph) | 1200 UTC 23 / 10 (October)/ 2015 | 1951- present | Hurricane Patricia in eastern Pacific Ocean | 17°18'N, 105°47'W |
| Maximum Surface Wind Gust for Tropical Cyclone | 113.2 m/s (253mph; 220 kt | 1055 UTC, 10/4 (April)/1996 | 1949-present | Barrow Island, Australia | 20°49'S, 115°23'E |
| Fastest Intensification | 100mb (976 to 876 mb) in just under 24 hours | 22-23/9 (September)/1983 | 1951- present | Typhoon Forrest in Northwest Pacific Ocean | 18°0'N, 136°0'E |
| Highest Storm Surge | 13m (42 feet) | 5/3 (March)/1899 | Tropical Cyclone Mahina; Bathurst Bay, Queensland, Australia | 14°15'S, 144°23'E | |
| First Identified South Atlantic Hurricane | 28/3 (March)/2004 | 1966-present | Tropical Cyclone Catarina; state of Santa Catarina, Brazil | approximately 27°S, 48°W | |
| Largest Tropical Cyclone (winds from center) | Gale winds [17m/s, 34 kt, 39mph] extending 1100km (675 mi) from center | 12/10 (October)/1979 | 1945- present | Typhoon Tip in Northwest Pacific Ocean | 16°44'N, 137°46'E |
| Smallest Tropical Cyclone (winds from center) | Gale winds [17m/s, 34kt, 39mph] extending 50km (30 mi) from center | 24/12 (December)/1974 | 1956- present | Tropical Cyclone Tracy near Darwin, Australia | 12°12'S, 130°00'E |
| Longest Lasting Tropical Cyclone | 31 days | 10/8 (August)/1994- 10/9 (September)/1994 | 1945- present | Hurricane / Typhoon John in Northeast & Northwest Pacific Basins | |
| Longest Distance Traveled by Tropical Cyclone | 13180 km (8.189.7 miles, 7116.6 naut. miles) | 10/8 (August)/1994- 10/9 (September)/1994 | 1961-present (satellite era) | Hurricane / Typhoon John in Northeast & Northwest Pacific Basins | |
| Smallest eye | 6.7km (4 mile) | 24/12 (December)/1974 | 1956-present | Tropical Cyclone Tracy at Darwin Australia | 12°12'S, 130°00'E |
| Largest eye | 90km (56 mile) | 21/2 (February)/1979 | 1956-present | Tropical Cycle Kerry, Coral Sea | 17°30'S, 154°06'W |
| Largest Rainfall of Tropical Cyclones | Value | Date (D/M/Y) | Length of Record | Tropical Cyclone | Latitude/ Longitude |
|---|---|---|---|---|---|
| 12 hr | 1.144m (45.0") | 7-8/1 (January)/1966 | 1966-1990 | Tropical Cyclone Denise in South Indian Ocean | 21°14'S, 55°41'E |
| 24 hr | 1.825m (71.8") | 7-8/1 (January)/1966 | 1966- 1990 | Tropical Cyclone Denise in South Indian Ocean | 21°15'S, 55°40'E |
| 48 hr | 2.467m (97.1") | 7-9/4 (April)/1958 | 1968- present | Unnamed Tropical Cyclone In South Indian Ocean | 21°00'S, 55°26'E |
| 72 hr | 3.930m (154.72") | 24-27/2 (February) /2007 | 1968-present | Tropical Cyclone Gamede in South Indian Ocean | 21°12'S, 55°39'E |
| 96 hr | 4.936m (194.33") | 24-28/2 (February)/2007 | 1968-present | Tropical Cyclone Gamede in South Indian Ocean | 21°12'S, 55°39'E |
| 10-day | 5.678m (223.5") | 18-27/1 (January)/1980 | 1968- present | Tropical Cyclone Hyacinte in South Indian Ocean | 21°12'S, 55°39'E |
World Meteorological-Related Phenomena Records
| Phenomena Characteristic | Value | Date (D/M/Y) | Length of Record | Geopolitical Location | Longitude/ Latitude | Elevation |
|---|---|---|---|---|---|---|
| World's Highest Significant Wave Height by Ship Observation | 18.5 m (60.7 ft) | 2214 UTC 8/2 (February)/2000 | North Atlantic | 57°30'N, 12°42'W | 0m (0 ft) | |
| World’s Highest Significant Wave Height by Buoy | 19.0 m (62.3 ft) | 0600 UTC 4/02 (February)/2013 | North Atlantic | 59°07'N, 11°42'W | 0m (0 ft) |