World: Highest Significant Wave Height as measured by a Buoy
| Record Value | 19.0 m (62.3 ft) |
|---|---|
| Date of Record | 0600 UTC 4/02/2013 |
| Length of Record | |
| Instrumentation | Datawell heave sensor |
| Geospatial Location | Buoy K5 (a part of the UK Met Office’s network of Marine Automatic Weather Stations, or MAWS)[59°07.3'N, 11°42.5'W, elevation: 0m)] |
References
Discussion
Note that this is "significant" wave height -- in essence, what an observer would have seen if he/she averaged over 15-20 waves passing by the buoy -- that is a much better thing than "rogue waves" which really cannot be accurately measured. According to one of our of panel's "wave experts": "There have been many more less reliable estimates of rogue waves from other platforms, and from satellite SAR. These are generally unverifiable, since there is no ground truth for the satellite, and the others tend to be from pitching and rolling platforms such as ships, and estimates are often based on damage to the superstructure, which may not have been level at the time."
Instrumentation: Datawell heave sensor. Significant wave height recorded is four times the RMS value of the water level above the average level of the water surface measured over a 17½ minute period. The factor of 4 applied to the RMS value is because the waves are trochoidal in nature. (Waves at sea, especially those growing under the influence of the wind, tend to be short-crested, i.e. the wave crests project further above the mean level than the troughs are below it.) The ‘average’ wave period, again over a 17½ minute sample, is the average of the periods over 7 successive 2½ minute samples (each determined from the number of wave cycles in the sample).
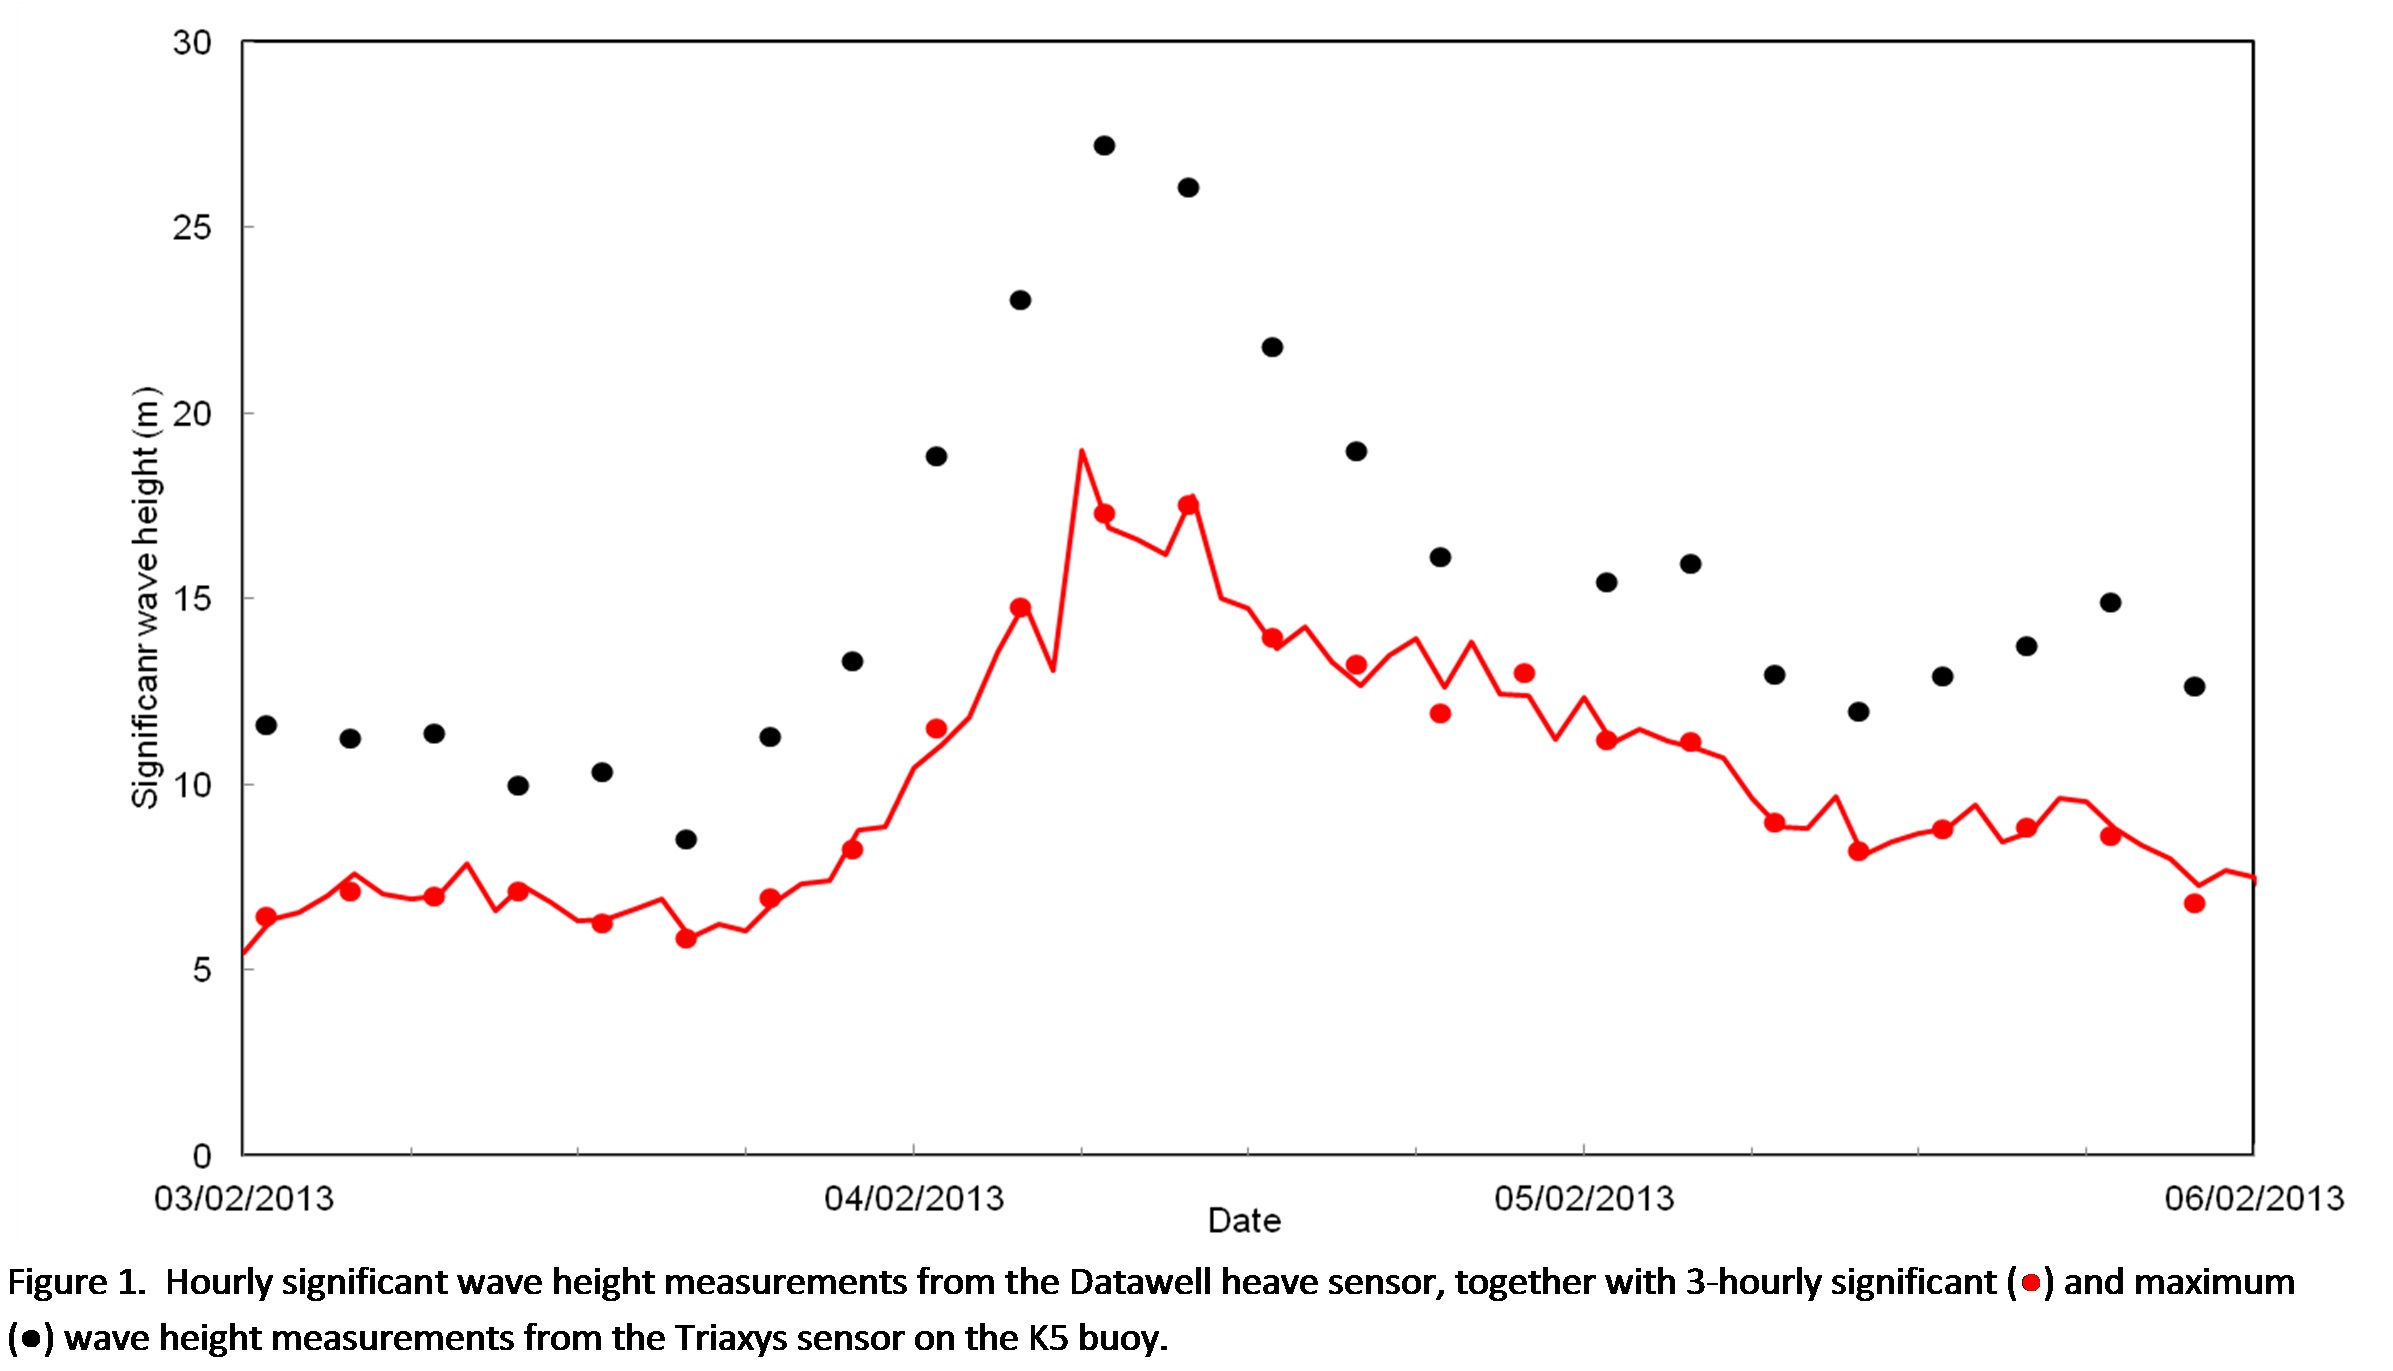
In addition to the Datawell heave sensor mounted on the K5 it also carried a Triaxys spectral wave sensor, reporting spectral wave data every three hours. Unfortunately this had been to set to report at 0100, 0400, 0700, … (UTC) rather than the main synoptic hours so did not sample (20 minute averages) at the same hour as the heave sensor measured the highest (19.0 m) waves. Figure 1 shows the hourly significant wave heights from the Datawell heave sensor, together with the wave measurements from the Triaxys sensor.
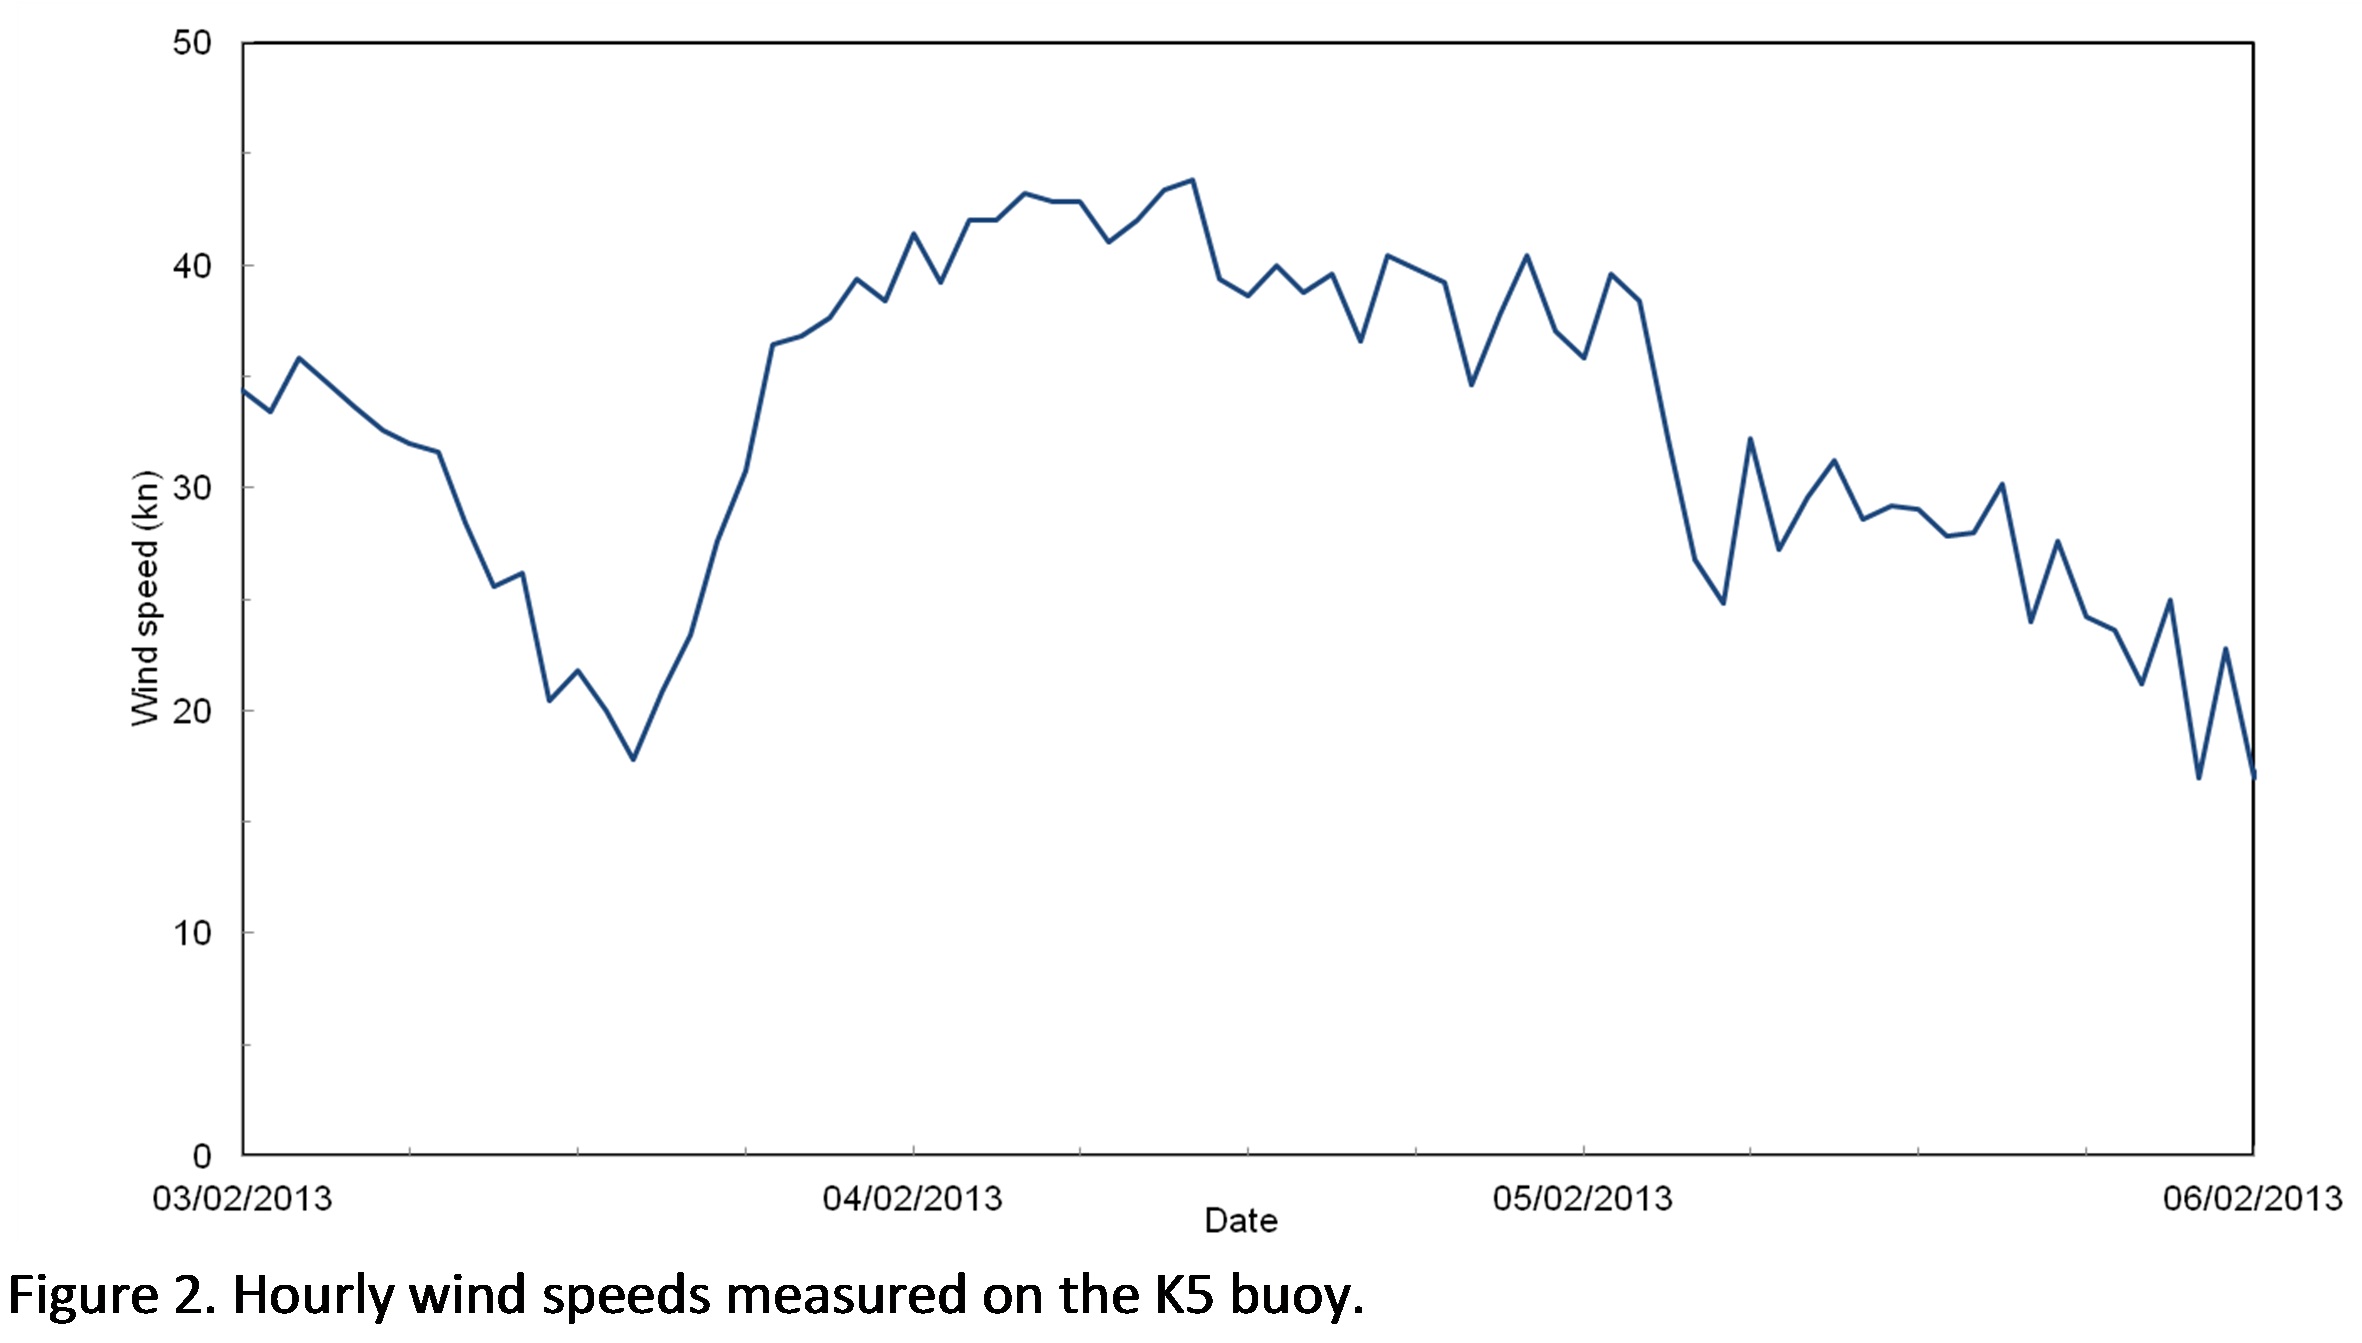
During the period of the highest waves the wind speeds measured on the buoy were over 35 kn for the 12 hours preceding the highest waves, with a maximum wind speed reported of 43.8 kn, as shown in Figure 2. The winds were measured using a Gill windsonic (acoustic) anemometer on the buoy at around 3½m above sea level. The synoptic situation at 0600 on 4th February is given in Figure 3 which shows an intense depression to the north of the buoy with prolonged strong westerly to northwesterly winds at the K5 station.
Record was evaluated by the committee of J. Turton, M. Brunet .T. Peterson, V. Swail, and R. Cerveny.

Figure 1 of the discussion

Figure 2 of the discussion